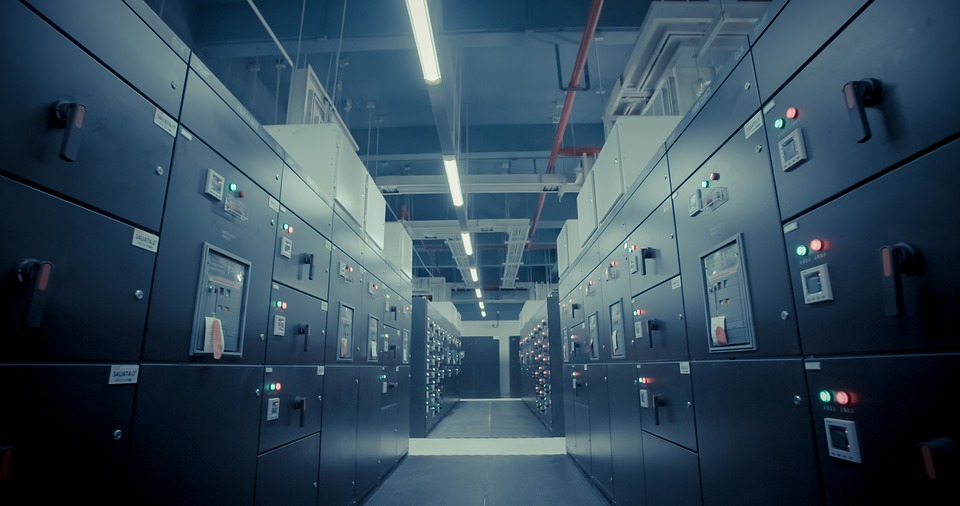
If a picture is worth 1,000 words, then the value of rich 3D visualizations of your data center is enormous. With DCIM software that provides high-fidelity visuals of the data center, data center professionals must no longer waste time making physical trips to the data center. In one glance, you can view cabinet elevations and see where and how devices are placed and connected or analyze power, temperature, and humidity sensor readings.
Still, however, some think of 3D data center visualizations as a gimmick and that it is all style without substance. This can be true for most data center management tools that incorporate flashy 3D, but not in any useful way that lets you get the most out of your data. A comprehensive DCIM solution will provide visuals that are faster, easier, and smarter than physically being in the data center.
Here are some of the ways DCIM dramatically improves data center visualization.
- X-ray views. Seeing inside your cabinets with Superman-like “x-ray” views lets you visualize the impossible. A modern DCIM solution will let you see side views of your racks without the side panels, flip from the front to the back of your row with superhuman speed, and enhance your vision with a detailed model, depth, alignment, and mounting information as well as sensor data for your devices.
- Thermal and pressure maps. Forecast and address changes in your data center environment with speed and accuracy for thermal and pressure maps of your data center with time-lapse video. This allows you to spot temperature and humidity trends over time across your entire data center floor map and identify and predict hotspot formation – from start to end.
- See above or below cabinets. A complete DCIM solution will allow you to see not just what’s in the cabinets, but what is under the floor or above the cabinets, such as cable trays.
- Correlated capacity and other floor map reports. DCIM provides easy-to-understand visual floor map reports such as capacity constraints to clearly illustrate capacity shortages, so you can purchase more as needed. Select multiple capacity parameters at the same time and set and update thresholds for individual reports to gain a more accurate view of capacity.
- Visualize cable connectivity. See exactly how items are connected on your data center floor with 3D visualizations of all the cabinet hops. Easily identify how your assets are connected at the power and data port level. View full circuits or only the endpoints, including patch cords, structured cabling, and distribution cabling. Match the cabling colors in your DCIM to the colors you use in your data center for extra accuracy.
- Models library with high-fidelity images. A comprehensive DCIM solution will provide a large and constantly updated library of asset models with high-fidelity 3D front and back images in addition to other information such as U space, dimensions, weight, and power and data ports. Sunbird, for example, has a library of over 30,000 models across over 450 manufacturers.


If you are looking for DCIM, or are currently using DCIM, be sure that your visualizations provide real value rather than just being nice to look at. Sunbird focuses on implementing 3D where it will enhance, not detract, in an elegant, useful way.
Want to try out Sunbird DCIM’s 3D data center visualizations for yourself? Test drive our second-generation DCIM software today to experience 3D that dramatically simplifies data center management.


